Loan Default Risk Prediction
A leakage-controlled machine learning analysis that ranks 2,000 small-business loan applications by default risk using application-time information only, compares four model families, and translates the results into a review-triage policy.
- Test ROC-AUC, selected model
- 0.831
- 95% CI 0.784–0.873 · 400 held-out applications
- Cross-validated ROC-AUC
- 0.803
- Logistic Regression · mean of 5 folds
- Test defaulters correctly flagged
- 112 of 148
- Recall 0.757 at threshold 0.5
- Default rate across four segments
- 8%–74%
- Held on unseen test data (8%–75%)
01Overview
Ranking default risk to direct limited review capacity
A lender receives small-business loan applications and has limited analyst time. The question is whether the information collected at application can identify which applicants are most likely to default, so that review effort goes where risk is highest.
The analysis delivers three things: a risk score for each applicant, an explanation of what the score relies on, and a description of natural applicant segments. The selected model ranks a randomly chosen defaulter above a randomly chosen repayer about 83% of the time on held-out data, versus 50% for no model.
Logistic Regression, a Decision Tree and a Neural Network performed the same within statistical noise, so the most transparent model was selected under a rule fixed before results were seen. Two signals — credit score and the owner's years of experience — carry most of the information.
02Dataset & objectives
Dataset and analytical objectives
The data are 2,000 anonymised small-business loan applications supplied for a university course, of which 37.1% defaulted. Eight application-time attributes are available as predictors.
- Loan applications
- 2,000
- Anonymised, course-supplied
- Default rate
- 37.1%
- Overall outcome prevalence
- Predictors
- 8
- All known at application
- Training / test split
- 1,600 / 400
- 80/20, before any modelling
Data quality checks found no missing values or duplicates, and values in plausible ranges. Large-revenue outliers were judged genuine and retained.
Predictors
| Attribute | Type |
|---|---|
| Business age | Firm profile |
| Annual revenue | Firm profile |
| Employees | Firm profile |
| Industry sector | Firm profile |
| Credit score | Credit history |
| Missed payments in prior year | Credit history |
| Owner experience | Owner profile |
| Requested loan amount | Loan request |
Analytical objectives
- 01Produce a risk score that ranks applications so review effort goes where risk is highest.
- 02Explain which application attributes the score relies on.
- 03Describe natural applicant segments without using the outcome.
- 04Frame the review cut-off as an explicit business trade-off rather than a fixed modelling default.
03Exploratory analysis
Exploratory analysis: where default concentrates
Default rates climb sharply with missed payments — from 12% for applicants with none to 61% with two (training data). Tech applicants default at 68%, versus 37% overall.
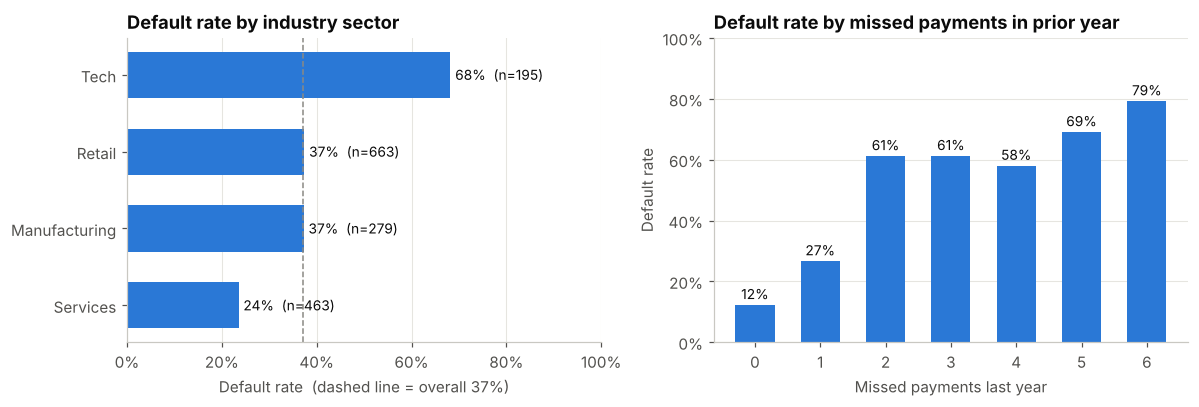
Both patterns are strong in isolation, but neither is the full story. Missed payments and credit score are strongly correlated (r = −0.79), and Tech applicants are concentrated among young businesses with weak credit. Whether these attributes add information once other signals are known is tested by the model in the interpretation chapter.
04Preparation & methodology
Data preparation and modeling methodology
The validation design was fixed before any modelling: 80% of applications for training and 20% held back as an untouched test set, with 5-fold cross-validation on the training set used to choose the model.
- Cross-validation
- 5-fold
- Training set only
- Model families
- 4
- Including majority-class baseline
- Full vs. Reduced features
- 8 vs. 4
- Compared for each model
- Test-set use
- 1×
- After the model was chosen
Modeling workflow
- 01Split 1,600 training and 400 test applications before any modelling.
- 02Compare a majority-class baseline, Logistic Regression, a Decision Tree and a Neural Network, each in Full (8-feature) and Reduced (4-feature) versions.
- 03Learn all scaling and encoding inside each cross-validation fold.
- 04Select the model with the highest cross-validated ROC-AUC; within 0.01, prefer the more interpretable model.
- 05Evaluate the selected model on the test set exactly once, with a 95% confidence interval.
Corrections to the original analysis
The original course submission contained a target-leakage error: the outcome was an input to the clustering step. It has been removed. Re-running the original code showed the leak did not raise the original model scores — the Decision Tree never used the leaked columns — but it invalidated the original segmentation statistics.
| Original issue | Correction |
|---|---|
| The outcome (Defaulted) was an input to K-Means, and each run's cluster labels fed the next run | Clustering uses application attributes only, fitted on training data |
| Those cluster labels were used as predictors | Removed from all models |
| Scaling fitted on all data before cross-validation | All preprocessing inside per-fold pipelines |
| No hold-out test; winner chosen on a 0.002 ROC-AUC gap | 80/20 split, pre-declared selection rule, single test evaluation with confidence interval |
| “Probability Measure” and “Entropy” reported as performance metrics | Replaced with standard metrics and a confusion matrix |
| Reduced feature set described as importance-based without evidence | Described as a simplicity trade-off; shown to cost some performance |
05Risk segmentation
Risk segmentation: four distinct applicant profiles
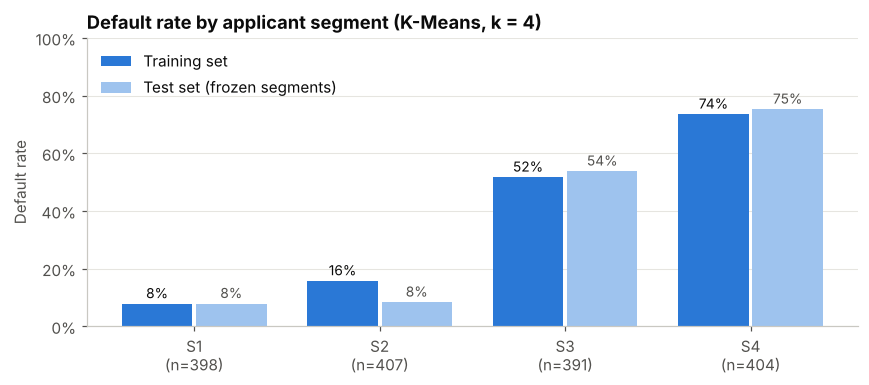
Clustering on application attributes alone — the outcome was not used — produced four well-separated groups (silhouette 0.560). Their default rates range from 8% to 74%, and those rates hold on the unseen test set.
Default rate by segment
| Segment | Training | Test |
|---|---|---|
| S1 — Established | 8% | 8% |
| S2 — Young, strong credit | 16% | 8% |
| S3 — Mid-size, weaker credit | 52% | 54% |
| S4 — New, inexperienced, poor credit | 74% | 75% |
Typical applicant per segment (training medians)
- 01S1 — Established: 20-year-old business, $3.25M revenue, credit score 780, no missed payments.
- 02S2 — Young, strong credit: 5-year-old business, $203K revenue, 3 staff, credit score 800.
- 03S3 — Mid-size, weaker credit: 58 staff, credit score 621, 2 missed payments.
- 04S4 — New, inexperienced, poor credit: 1.5-year-old business, owner experience 1.9 years, credit score 602, 4 missed payments; 48% Tech.
06Model comparison
Cross-validation and model comparison
The three Full models are statistically tied: cross-validated ROC-AUC of 0.803–0.806, with a fold-to-fold standard deviation of about 0.03 for every model. The 0.003 spread among them is not meaningful, so Logistic Regression was selected as the most interpretable.
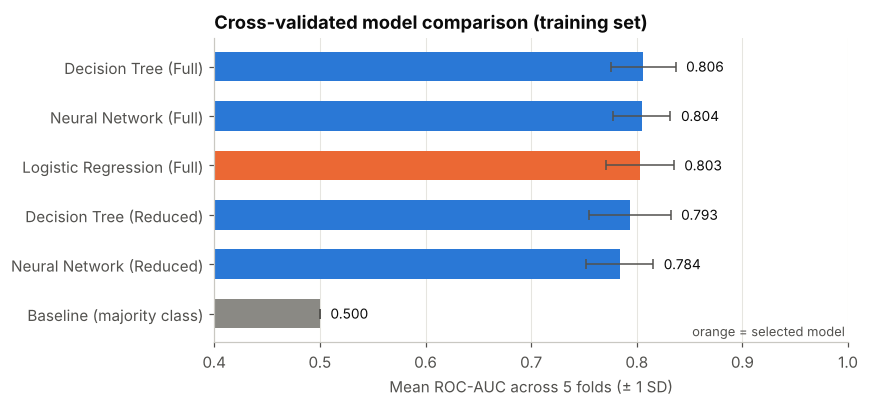
The baseline's 0.629 accuracy illustrates why accuracy alone is misleading here: predicting that no one defaults is right for most applicants while catching none of the defaulters. The Reduced (four-feature) models rank risk less well because they omit owner experience.
Cross-validation, training set (mean of 5 folds)
| Model | ROC-AUC | Accuracy | Precision | Recall | Specificity | F1 |
|---|---|---|---|---|---|---|
| Baseline (majority class) | 0.500 | 0.629 | 0.000 | 0.000 | 1.000 | 0.000 |
| Logistic Regression (Full) — selected | 0.803 | 0.741 | 0.644 | 0.682 | 0.775 | 0.661 |
| Decision Tree (Full) | 0.806 | 0.748 | 0.649 | 0.700 | 0.776 | 0.673 |
| Decision Tree (Reduced) | 0.793 | 0.742 | 0.641 | 0.695 | 0.769 | 0.666 |
| Neural Network (Full) | 0.804 | 0.748 | 0.647 | 0.719 | 0.764 | 0.679 |
| Neural Network (Reduced) | 0.784 | 0.747 | 0.630 | 0.781 | 0.727 | 0.697 |
07Test results
Final model evaluation on the hold-out test set
On 400 applications never used in model selection, the selected Logistic Regression achieved a test ROC-AUC of 0.831 (95% CI 0.784–0.873). At the default 0.5 threshold it correctly flagged 112 of 148 defaulters and wrongly flagged 53 of 252 repaying applicants.
- ROC-AUC
- 0.831
- 95% CI 0.784–0.873
- Recall
- 0.757
- 112 of 148 defaulters
- Specificity
- 0.790
- 199 of 252 repayers
- Precision
- 0.679
- Flagged who default
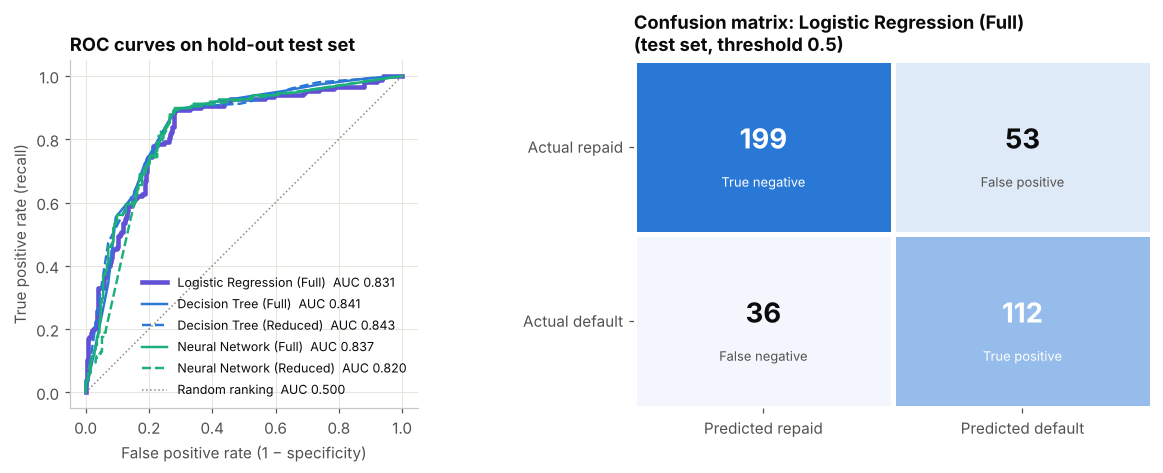
Hold-out test set (400 applications)
| Model | ROC-AUC | Accuracy | Precision | Recall | Specificity | F1 |
|---|---|---|---|---|---|---|
| Logistic Regression (Full) — selected | 0.831 | 0.778 | 0.679 | 0.757 | 0.790 | 0.716 |
| Decision Tree (Full) | 0.841 | 0.780 | 0.695 | 0.723 | 0.813 | 0.709 |
| Decision Tree (Reduced) | 0.843 | 0.773 | 0.682 | 0.723 | 0.802 | 0.702 |
| Neural Network (Full) | 0.837 | 0.775 | 0.667 | 0.784 | 0.770 | 0.720 |
| Neural Network (Reduced) | 0.820 | 0.783 | 0.656 | 0.865 | 0.734 | 0.746 |
08Model interpretation
Model interpretation and feature importance
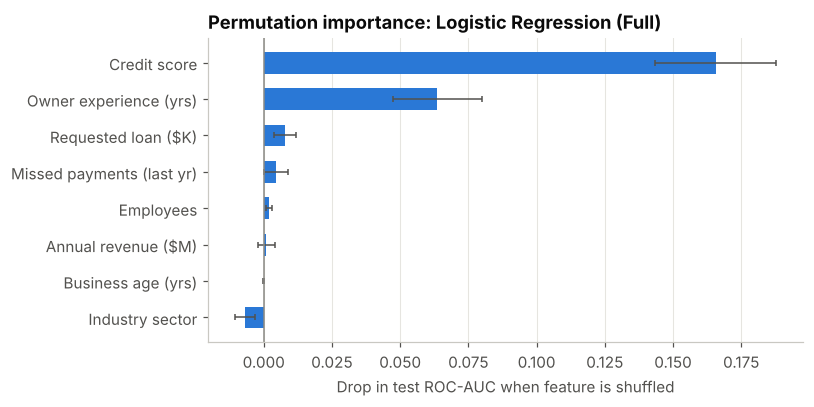
Credit score dominates; owner experience is second. Randomly shuffling credit score reduces the selected model's test ROC-AUC by 0.166, and owner experience by 0.064. Every other attribute reduces it by less than 0.01.
- Credit score
- −0.166
- Drop in test ROC-AUC when shuffled
- Owner experience
- −0.064
- Drop in test ROC-AUC when shuffled
- Every other attribute
- < 0.01
- Little added once these are known
The Decision Tree tells the same story: its first split is a credit score of 702. Applicants at or below that score defaulted at 63% in training, versus 12% above it.
Missed payments matter, but overlap with credit score (r = −0.79), so the model gains little from them once credit score is known. Industry sector is a proxy, not a driver, in this data: Tech applicants are concentrated among young businesses with weak credit, and once those attributes are accounted for, sector adds no predictive value.
09Threshold trade-offs
Classification threshold and business trade-offs
Where to set the review cut-off is a business decision, not a modelling one. A lower threshold catches more defaulters at the cost of more reviews. The trade-off below comes from out-of-fold predictions on the training data, so the test set played no part in it.
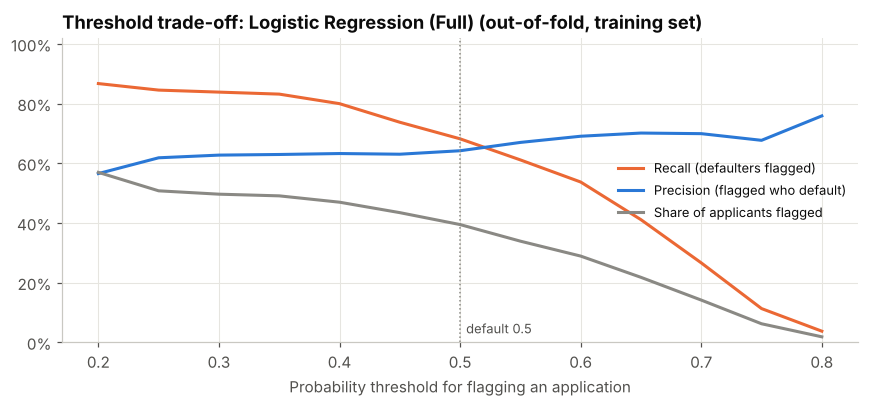
Moving from 0.50 to 0.30 raises the share of defaulters caught from 68% to 84% while increasing the review load from 39% to 50% of applications. Above 0.50, the review load drops quickly, but so does the share of defaulters caught.
Review policy options
| Threshold | Sent to review | Defaulters caught | Flagged who default |
|---|---|---|---|
| 0.30 | 50% | 84% | 63% |
| 0.40 | 47% | 80% | 63% |
| 0.50 (default) | 39% | 68% | 64% |
| 0.60 | 29% | 54% | 69% |
| 0.70 | 14% | 27% | 70% |
10Insights & recommendations
Business insights, recommendations, and next steps
With test ROC-AUC around 0.83, the model is a reasonable triage tool for ordering an analyst's queue. It is not accurate enough, nor sufficiently validated, to approve or decline applications automatically.
Recommended next steps
| Limitation | Recommended next step |
|---|---|
| Dataset source and period undocumented | Confirm provenance; re-run on real lending data |
| Timing of missed-payments field assumed | Confirm field definition with the data owner |
| Small sample (400-row test set) | Validate on more data |
| Random, not time-based, split | Out-of-time validation on later applications |
| Original hyper-parameters kept, no tuning | Tune inside cross-validation, then re-test on fresh data |
| Calibration, fairness and reject inference not assessed | Calibration check; fair-lending review; reason codes before any operational use |
Recommendations
- 01Use the score to prioritise review, not to decide. Order the analyst queue by risk and keep approval decisions with underwriters.
- 02Choose the review threshold deliberately, using the lender's own costs of a missed default and of an extra review.
- 03Prefer explainability when performance is tied. Logistic Regression matched the more complex models while offering clear direction-of-effect coefficients — an advantage in regulated lending, where decisions may need to be explained to applicants.
- 04Reuse the workflow: define the decision, confirm what is known at decision time, separate training from testing, pre-commit to a selection rule and report uncertainty. It applies directly to other operational problems, such as prioritising service follow-ups.
Data
Small-business loan applications
Course-supplied, anonymised · 2,000 applications · 37.1% defaulted
- Business age, annual revenue, employees, and industry sector
- Credit score and missed payments in the prior year
- Owner experience and requested loan amount
- Default outcome (target only — never used as an input)
Limitations
Limitations
- Dataset source and period are undocumented, and its structure suggests it may be synthetic; results may not transfer to real portfolios.
- The missed-payments field is assumed to precede the application; if recorded later, it would leak outcome information.
- With a 400-row test set, test ROC-AUC is uncertain by about ±0.045.
- A random, not time-based, split leaves performance under changing economic conditions unknown.
- Original hyper-parameters were kept without tuning; the tree and network may be slightly under-fitted.
- Calibration, fairness and reject inference were not assessed: probabilities may be mis-scaled, disparate impact is untested, and declined applicants are absent.
Technologies
- Jupyter Notebook
- Logistic Regression
- Decision Tree
- Neural Network
- K-Means Clustering
- Cross-Validation
- Permutation Importance