CFPB Consumer Complaints Analytics — 2025
An Excel-based performance, discrepancy, and decision analysis of 482,074 CFPB consumer complaints received in 2025 across checking or savings accounts, credit cards, debt collection, and mortgages.
- Complaints analyzed
- 482,074
- Received Jan 1–Dec 31, 2025 · four products
- Overall untimely response rate
- 1.98%
- 9,523 complaints recorded as untimely
- Untimely cases from debt collection
- 86.1%
- vs. 58.7% of complaint volume
- Modeled cases avoided
- 4,627
- Strong portfolio scenario · conditional, not a forecast
01Executive summary
Concentration, not merely volume
The principal business finding is concentration. Across 482,074 complaints, 9,523 were recorded as untimely — an overall rate of 1.98%. Debt collection accounted for 58.7% of complaints but 86.1% of untimely complaints, with a 2.89% untimely rate materially above the other analyzed products.
Three additional findings change how performance should be interpreted. Monthly volume and response timeliness did not move together: January produced the most complaints (53,474), whereas April recorded the highest untimely rate (2.61%). A deep investigation of CCS Financial Services, Inc. found its recorded untimely rate fell from 58.24% (January–August) to 2.64% (September–December), and decomposition showed that changing issue composition did not explain the decline. Finally, apparent geographic underperformance partly reflects company mix: excluding CCS reduces Georgia's benchmark-adjusted excess untimely cases from 275.41 to 144.27, a 47.6% decrease.
A decision model translates these observations into conditional outcomes. Under a specified strong-improvement scenario, modeled untimely cases decrease from 9,523 to approximately 4,896 at unchanged complaint volumes. A 10,000-run historical-pattern simulation gives a mean of 9,541 untimely cases and a 13.18% modeled probability of exceeding a hypothetical 10,000-case threshold. These are decision-support illustrations, not forecasts or validated causal effects.
02Dataset & objectives
Dataset overview and analytical objectives
Complaint volume alone is an incomplete performance measure. A high-volume category may have a low rate of recorded untimeliness; a smaller category may have a high rate but contribute little to the total number of late responses. The analysis therefore evaluates volume, untimely-response rate, and absolute untimely cases together.
- Complaints
- 482,074
- Received in 2025
- Product categories
- 4
- Selected analytical extract
- Records matched to a state
- 480,344
- 1,730 lacked state information
- Workbook worksheets
- 15
- CFPB_2025_Project.xlsx
The underlying public export was scoped upstream to checking or savings accounts, credit cards, debt collection, and mortgages, followed by enrichment and validation. The original record count was preserved throughout. 158 sub-issue fields were missing. 12,762 records had forwarding intervals exceeding 30 days; these were flagged, not declared erroneous. 64,231 records matched an earlier record on non-ID attributes, but all complaint IDs were unique and no records were removed solely for attribute similarity.
Analytical objectives
- 01Identify where recorded response risk concentrates across products, months, issues, companies, and states.
- 02Investigate unusual patterns and test competing explanations before attributing causes.
- 03Translate observed gaps into explicit, conditional improvement scenarios.
- 04Quantify how variable annual untimely cases might be under historical month-level patterns.
03Performance & KPIs
Performance overview and KPIs
Debt collection's share of untimely complaints (86.1%) is considerably larger than its share of complaint volume (58.7%). The concentration is not simply a by-product of volume; the category also has the highest rate among the four analyzed products.
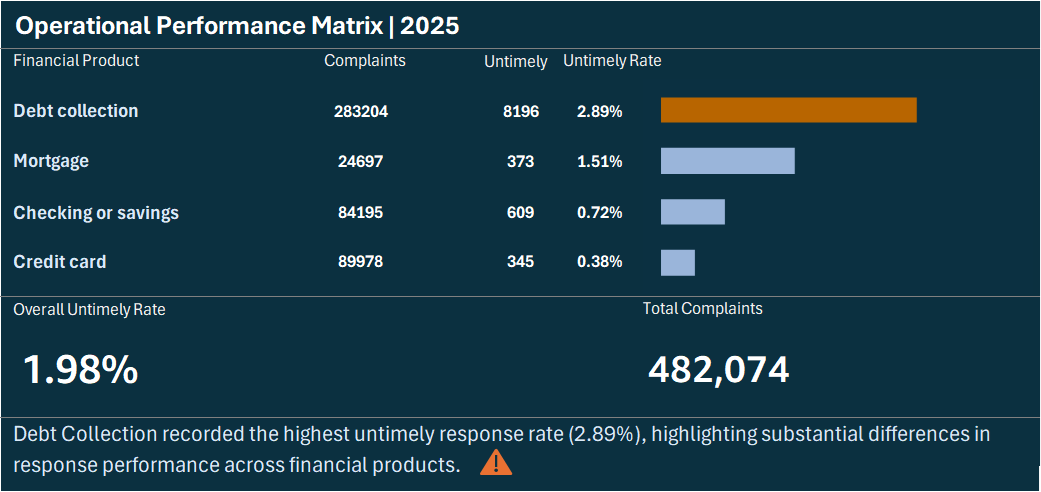
Mortgage has a higher rate than checking/savings and credit cards, but a much smaller absolute untimely burden. These distinctions matter when the business objective is to reduce the number of delayed responses rather than only to rank categories by rate.
Product performance, 2025
| Financial product | Complaints | Untimely | Untimely rate |
|---|---|---|---|
| Debt collection | 283,204 | 8,196 | 2.89% |
| Credit card | 89,978 | 345 | 0.38% |
| Checking or savings account | 84,195 | 609 | 0.72% |
| Mortgage | 24,697 | 373 | 1.51% |
| Total | 482,074 | 9,523 | 1.98% |
04Monthly analysis
Monthly performance: peak activity is not peak untimeliness
January was the highest-volume month despite having one of the lowest untimely rates. April's 2.61% rate was the highest, even though April volume was far below January's — a caution against using raw complaint counts as a proxy for response quality.
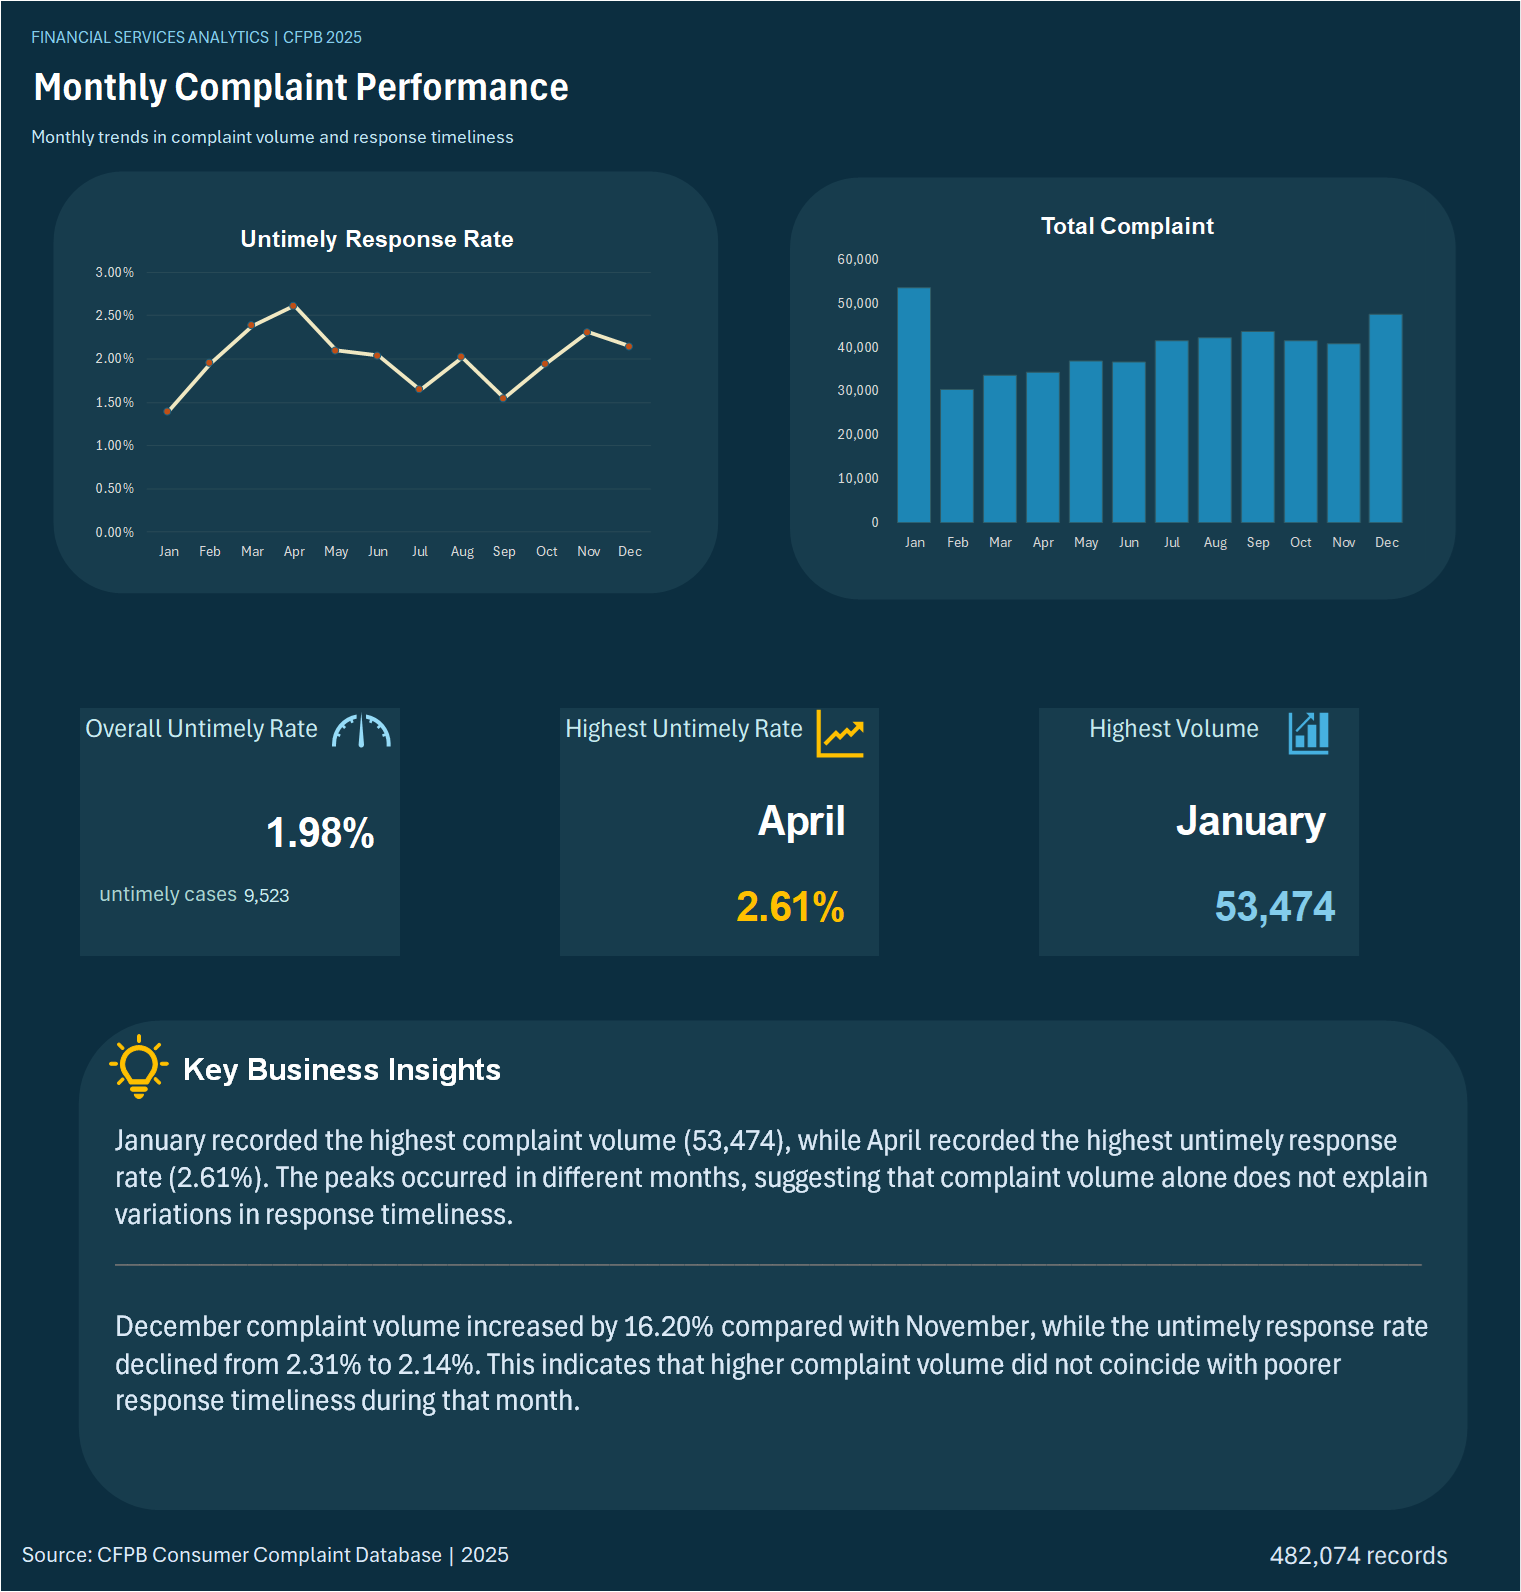
Complaint volume fell 43.05% in February. It rebounded later in the year, with December reaching 47,481 complaints, 16.20% higher than November.
Within checking or savings accounts, 9,907 complaints were recorded during January 15–18. Two institutions represented 8,563 (86.43%) of those: Navy Federal Credit Union (4,417) and Capital One Financial Corporation (4,146). This is strong evidence of a concentrated reporting or complaint-volume episode; it is not enough to conclude that the cause was a service outage, operational failure, or erroneous record.
Monthly complaints and untimely rate, 2025
| Month | Complaints | Untimely rate |
|---|---|---|
| January | 53,474 | 1.39% |
| February | 30,451 | 1.95% |
| March | 33,518 | 2.38% |
| April | 34,276 | 2.61% |
| May | 36,837 | 2.10% |
| June | 36,684 | 2.04% |
| July | 41,553 | 1.64% |
| August | 42,096 | 2.02% |
| September | 43,482 | 1.55% |
| October | 41,359 | 1.95% |
| November | 40,863 | 2.31% |
| December | 47,481 | 2.14% |
05Company, issue & geography
Company, issue, and geographic analysis
Segment views distinguish the most common problems and the largest populations from the segments with the highest recorded late-response rates — and show where composition, rather than performance, drives an apparent difference.
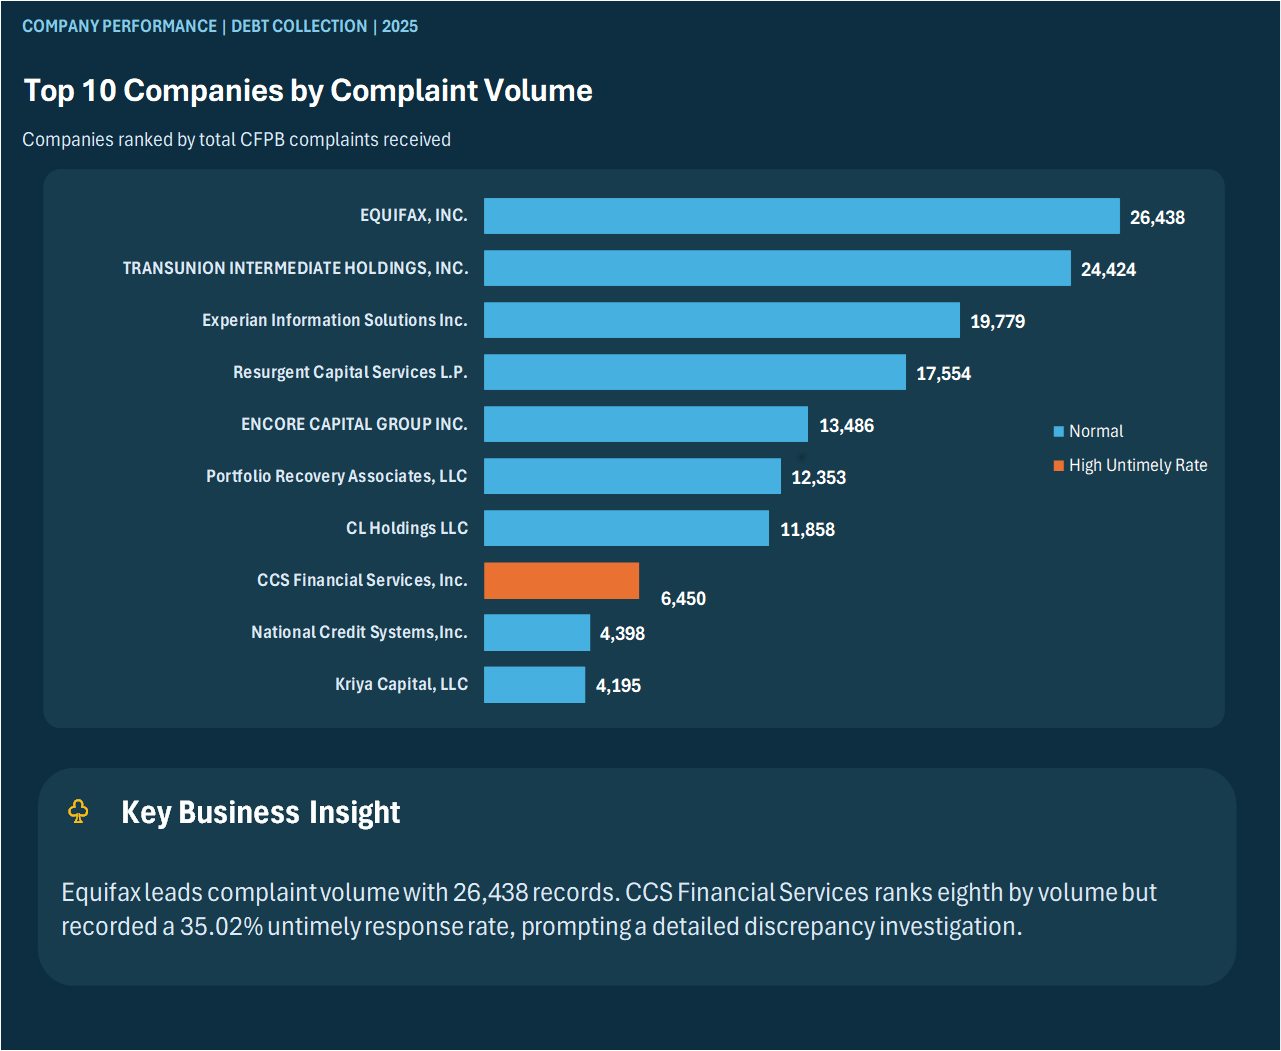
Among the high-volume debt-collection companies shown in the workbook, CCS Financial Services, Inc. had 6,450 debt-collection complaints, of which 2,259 (35.02%) were recorded as untimely. That annual average obscures a dramatic change over the year, investigated in the next section.
Issue-level patterns: the type of problem matters
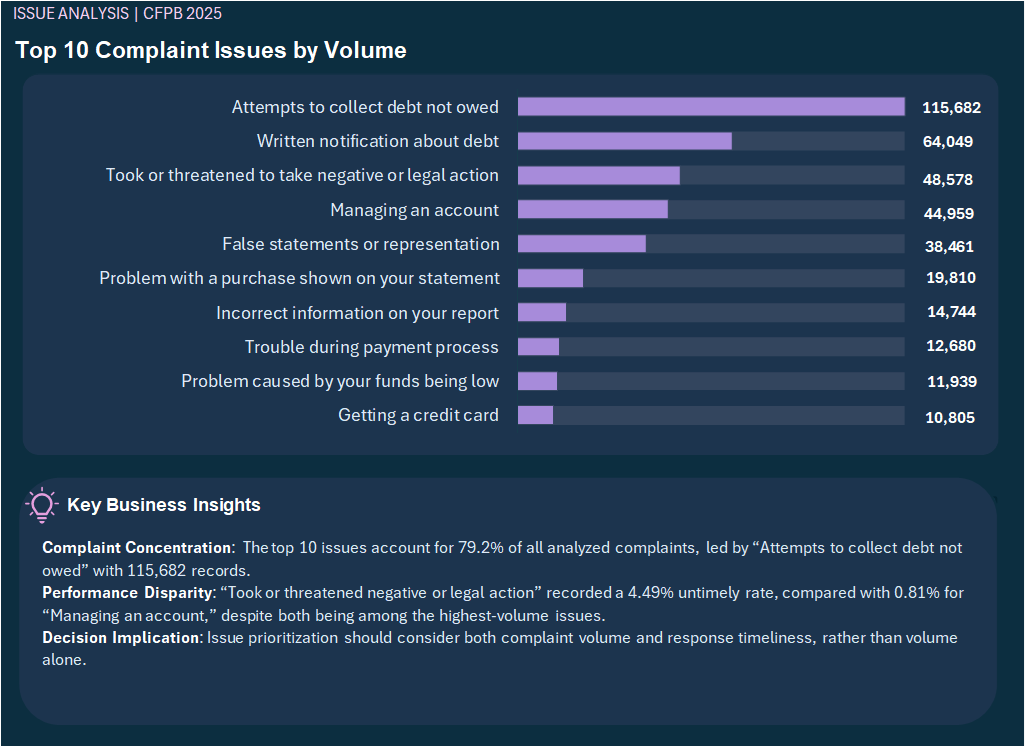
“Attempts to collect debt not owed” was the largest listed issue by volume, but “Took or threatened to take negative or legal action” had a higher untimely rate (4.49%) and contributed 2,182 untimely cases. “Communication tactics” also had a relatively high rate (3.79%) despite a much smaller volume.
Selected issues
| Issue | Complaints | Untimely | Untimely rate |
|---|---|---|---|
| Attempts to collect debt not owed | 115,682 | 2,989 | 2.58% |
| Written notification about debt | 64,049 | 1,181 | 1.84% |
| Took or threatened to take negative or legal action | 48,578 | 2,182 | 4.49% |
| Managing an account | 44,959 | 363 | 0.81% |
| False statements or representation | 38,461 | 1,261 | 3.28% |
| Communication tactics | 9,519 | 361 | 3.79% |
Geographic patterns: an impact measure, with a qualification
The state-only benchmark covers the 50 U.S. states: 477,871 complaints and 9,451 untimely cases, or 1.98%. Excess cases compare observed untimely cases with those expected at the pooled 50-state rate (observed untimely − state volume × benchmark rate), so the measure incorporates population size.
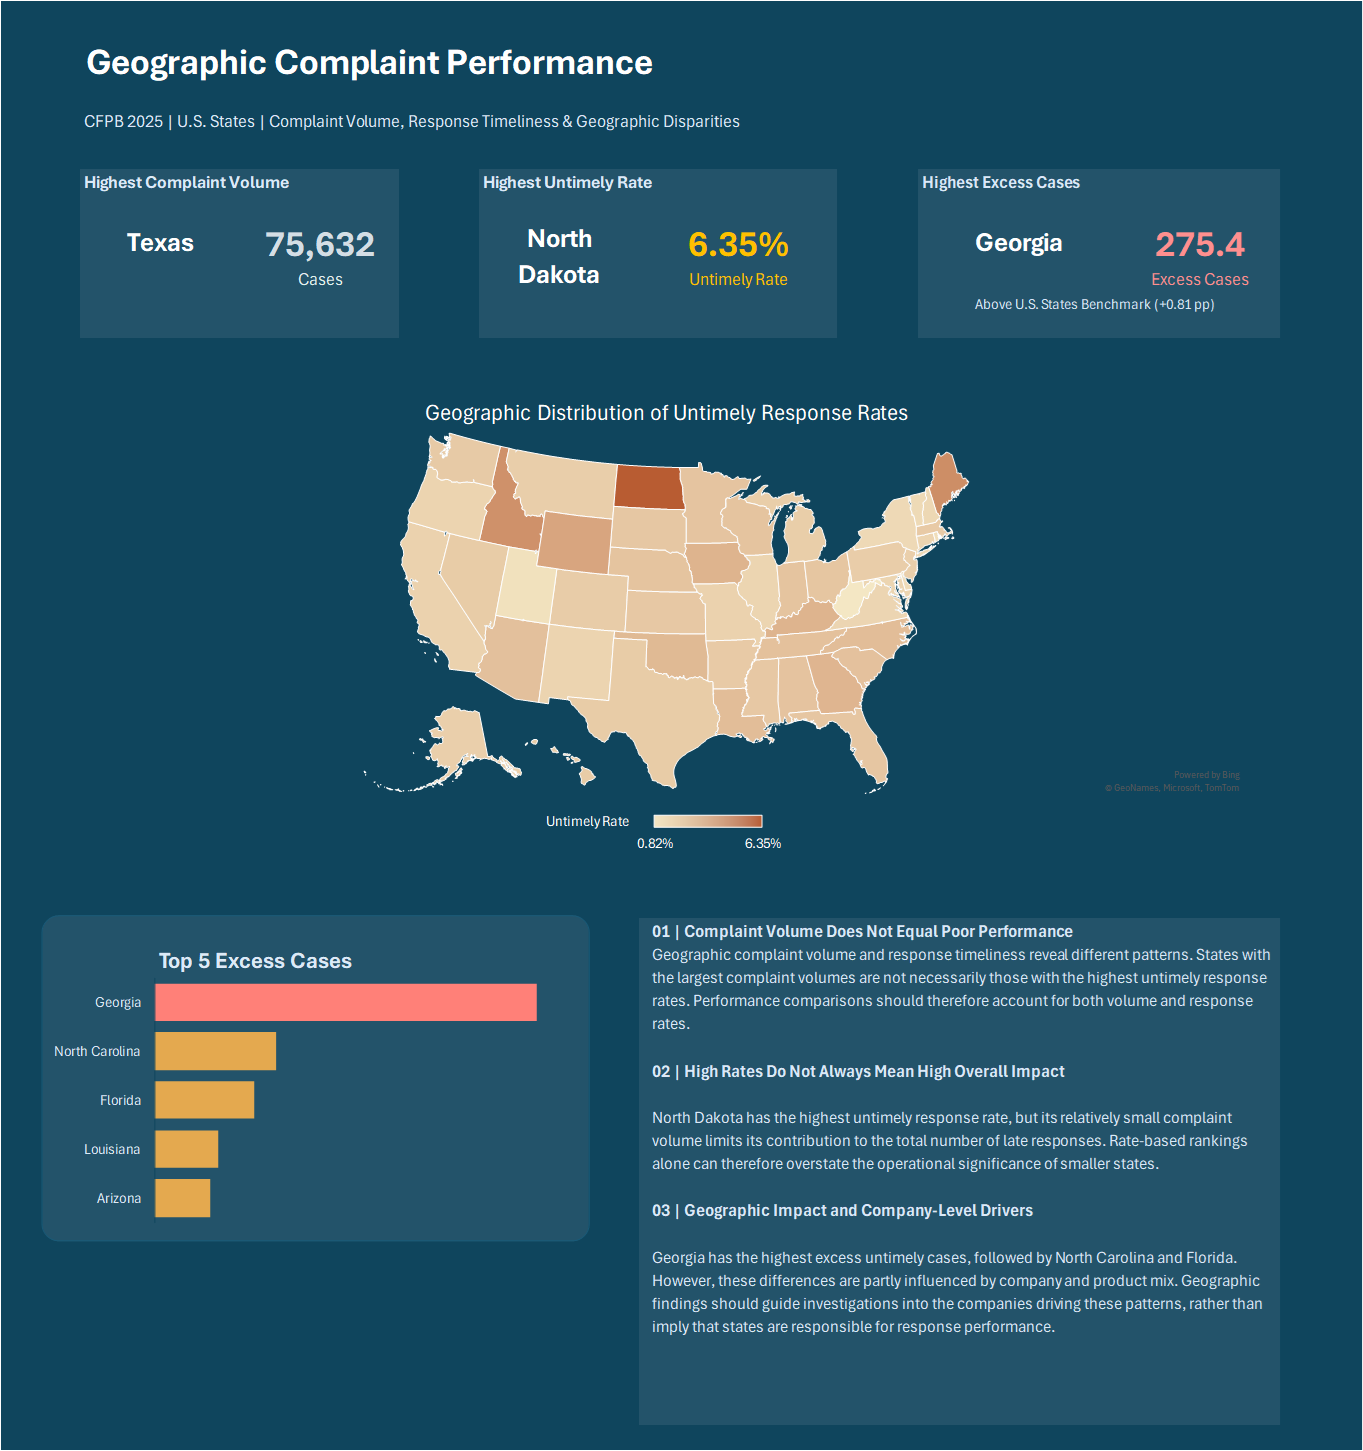
Of Georgia's 946 untimely cases, 296 (31.29%) were associated with CCS Financial Services. When CCS is excluded from both Georgia's observed cases and the benchmark population, Georgia's excess falls from +275.41 to +144.27 — a 47.6% reduction. Geography is therefore partly reflecting which companies are represented in each state; product composition is another potential confounder.
Highest excess untimely cases vs. 50-state benchmark
| State | Complaints | Untimely | Rate | Excess cases |
|---|---|---|---|---|
| Georgia | 33,907 | 946 | 2.79% | +275.41 |
| North Carolina | 17,466 | 433 | 2.48% | +87.57 |
| Florida | 51,360 | 1,088 | 2.12% | +72.24 |
| Louisiana | 9,341 | 231 | 2.47% | +46.26 |
| Arizona | 10,850 | 255 | 2.35% | +40.42 |
Three rankings, three different questions
- 01Highest volume: Texas — 75,632 complaints.
- 02Highest untimely rate: North Dakota — 6.35%, but only 28 untimely cases among 441 complaints.
- 03Highest excess untimely cases against the 50-state benchmark: Georgia — +275.41.
06Discrepancy investigation
Discrepancy investigation: explaining the CCS shift
Within debt collection, CCS Financial Services' recorded untimely rate fell from 58.24% in January–August to 2.64% in September–December — a 55.60 percentage-point drop and a 95.47% relative reduction.
- Untimely rate, Jan–Aug
- 58.24%
- 2,188 of 3,757 complaints
- Untimely rate, Sep–Dec
- 2.64%
- 71 of 2,693 complaints
- Observed change
- −55.60 pp
- 95.47% relative reduction
- Two-proportion test
- Z = 46.16
- p < 0.001, under its assumptions
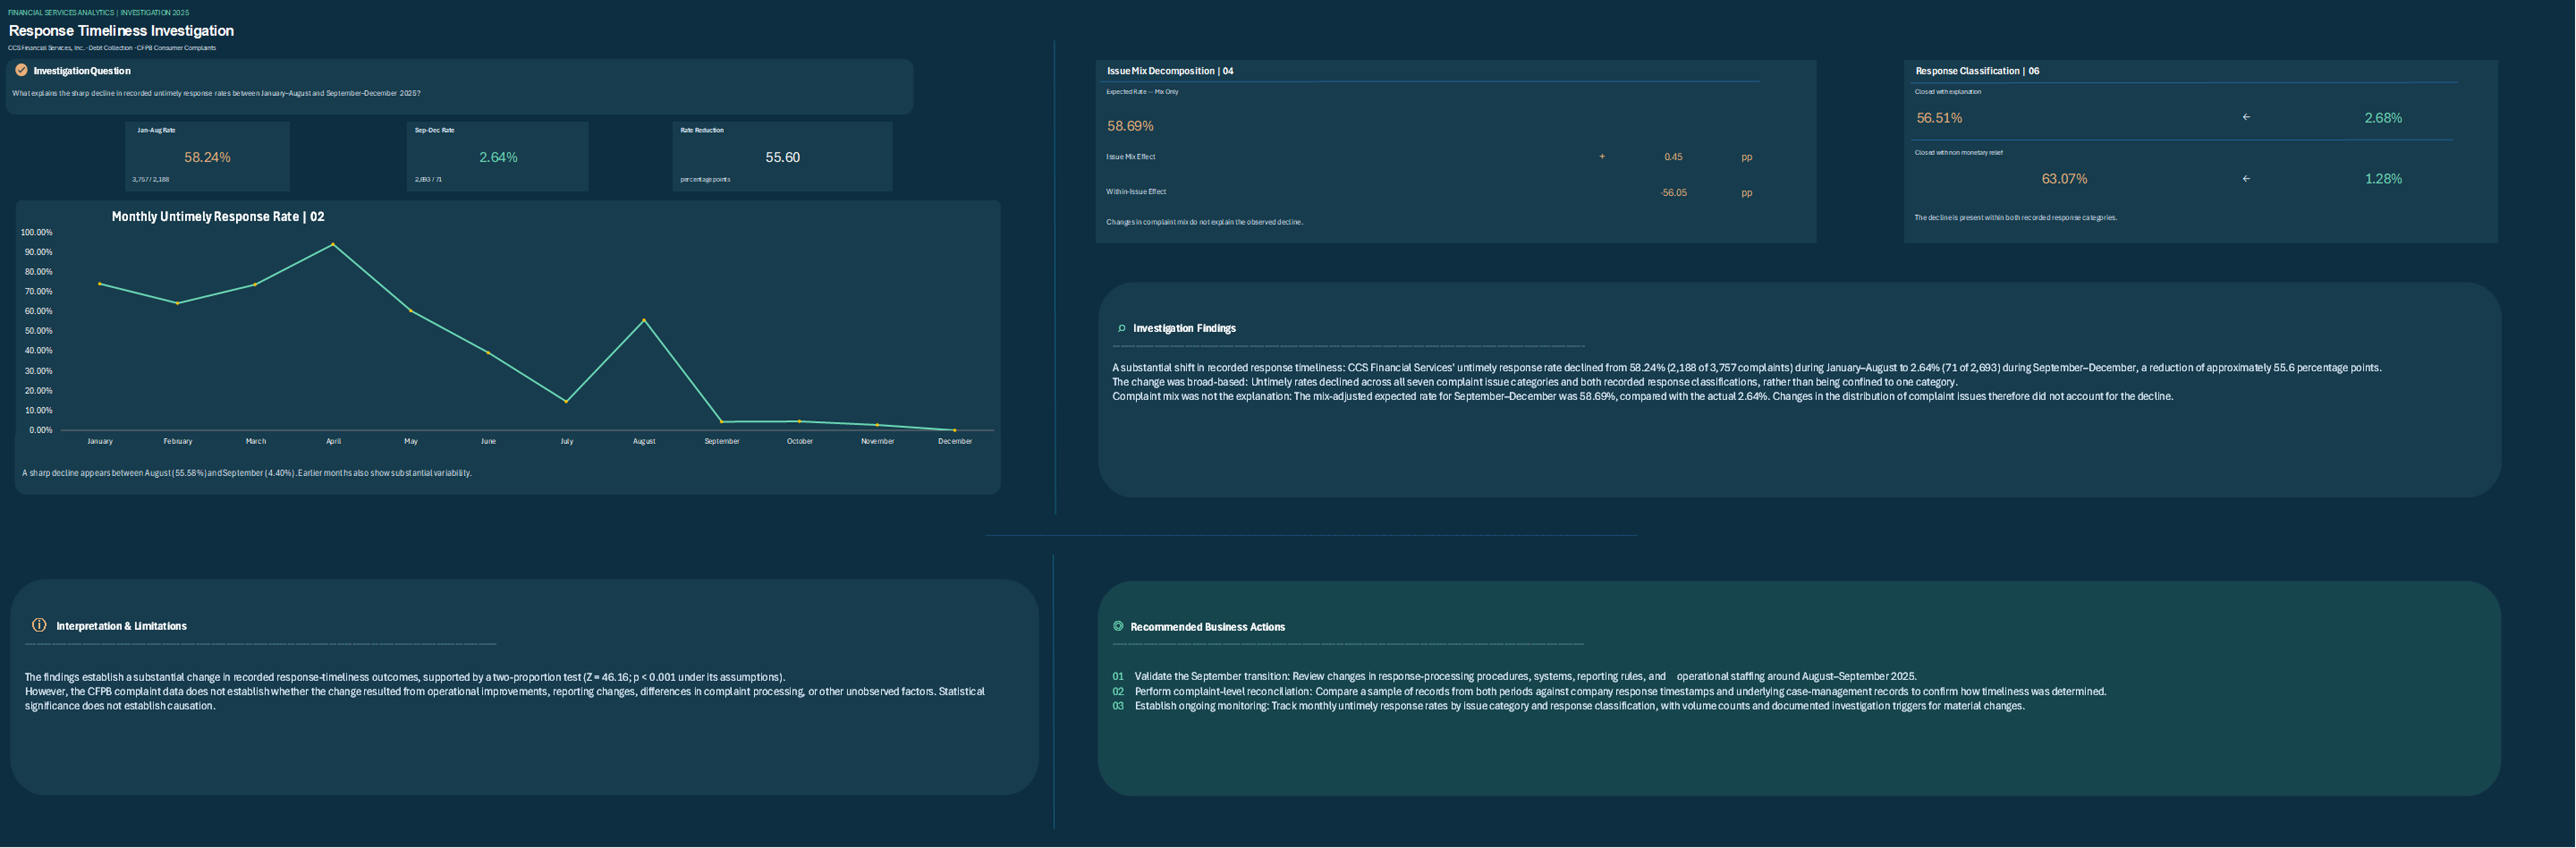
The mix-only counterfactual is approximately 58.69%, slightly above the early-period actual rate of 58.24%. A changed distribution of complaint issues therefore cannot explain the decline. Recorded untimeliness fell within all seven investigated issue categories, and within both recorded company response classifications.
Rate-change decomposition
| Component | Contribution |
|---|---|
| Change attributable to issue mix | +0.45 pp |
| Change attributable to within-issue rates | −56.05 pp |
| Net observed change | −55.60 pp |
Screening beyond one company
A curated discrepancy screen extends the investigation beyond CCS. These cases were identified through segmentation and then verified against the data; they are not an exhaustive algorithmic scan of every company.
| Screened pattern | Verified evidence |
|---|---|
| Servicer under contract with Federal Student Aid | 651 of 651 complaints marked untimely; 59.29% occurred in Q4 |
| Rent Recovery Solutions | Jan–May 0% untimely; Oct–Dec 100%; 575 complaints in the annual screening cohort |
| January checking/savings concentration | 8,563 of 9,907 (86.43%) complaints on Jan 15–18 linked to Navy Federal and Capital One |
Investigative workflow
- 01Detect a disproportionate or abrupt pattern.
- 02Verify the numerator and denominator.
- 03Test competing explanations.
- 04Decide what additional evidence is needed.
07Baseline & What-If
Baseline and What-If scenario modeling
The workbook compares the actual 2025 baseline with hypothetical reductions in untimely response rates at the observed 2025 complaint volumes, converting observed gaps into explicit, conditional scenarios.
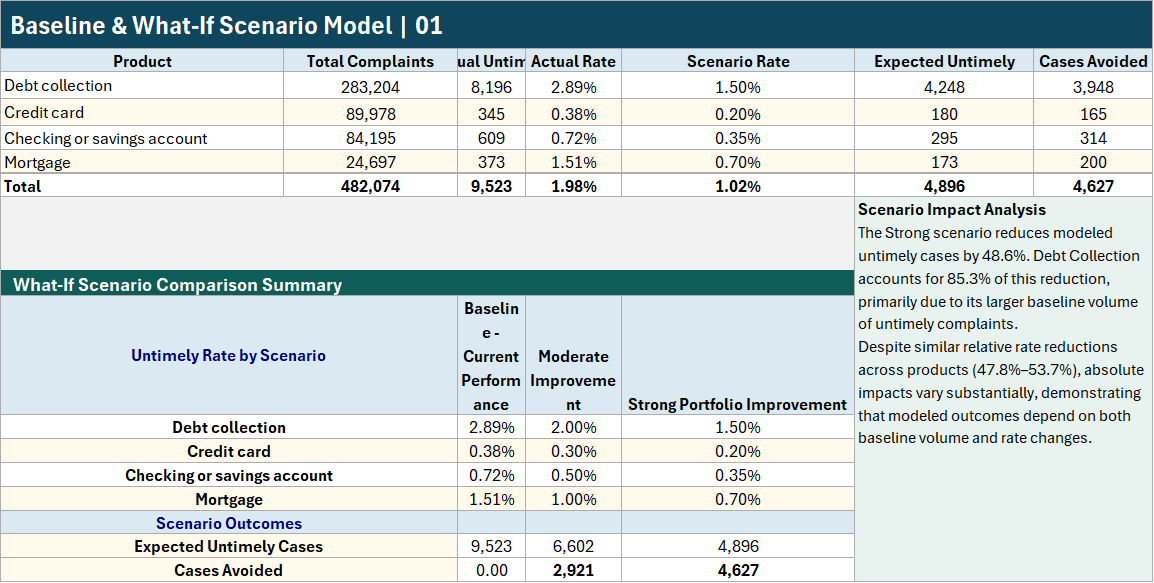
The strong case corresponds to a 48.6% modeled reduction in untimely cases. Under that scenario, debt collection contributes approximately 3,948 of the 4,627 modeled avoided cases (85.3%), again reinforcing its numerical importance to the portfolio.
Portfolio-wide scenario comparison
| Scenario | Modeled untimely cases | Cases avoided |
|---|---|---|
| Observed baseline | 9,523 | — |
| Moderate portfolio improvement | ≈6,602 | ≈2,921 |
| Strong portfolio improvement | ≈4,896 | ≈4,627 |
08Sensitivity & Goal Seek
Sensitivity analysis and Goal Seek
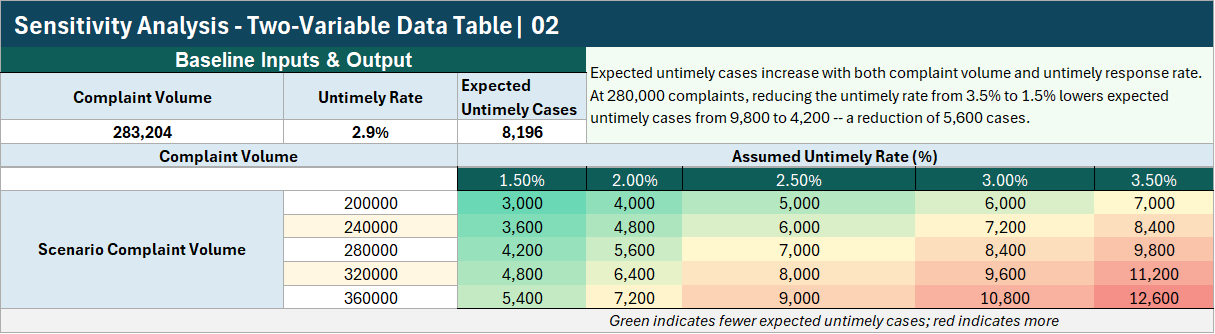
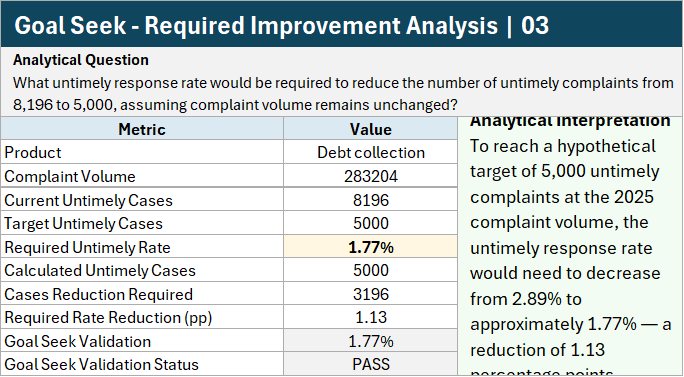
A two-variable data table compares scenario combinations, and Goal Seek frames the reverse question: at the same annual debt-collection volume, what untimely rate corresponds to a target of 5,000 untimely cases rather than 8,196?
- Debt-collection complaints
- 283,204
- Held constant
- Required untimely rate
- 2.89% → 1.77%
- Approximate; −1.13 pp
- Target untimely cases
- 5,000
- 3,196 fewer than observed 8,196
09Monte Carlo simulation
Monte Carlo simulation and scenario distributions
A deterministic scenario reports a single number under a fixed assumption. The Monte Carlo analysis asks how annual untimely cases could vary if historical month-level patterns recurred in different combinations.
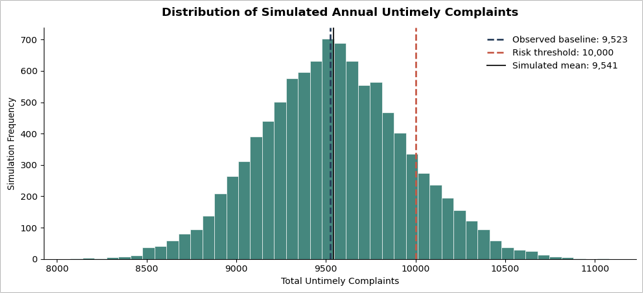
The model uses 10,000 seeded runs. It pairs monthly complaint volume and response rates during historical resampling, while translating outcomes to the fixed 2025 annual product volumes — preserving structure that would be lost if volumes and rates were drawn independently. It is a historical-pattern risk illustration, not a time-series forecast.
Current-condition distribution
| Measure | Simulated result |
|---|---|
| Observed 2025 untimely cases | 9,523 |
| Simulated mean | 9,541 |
| Standard deviation | 408 |
| 5th percentile | 8,883 |
| 95th percentile | 10,230 |
| Probability of exceeding 10,000 cases | 13.18% |
Why debt collection dominates simulated variability
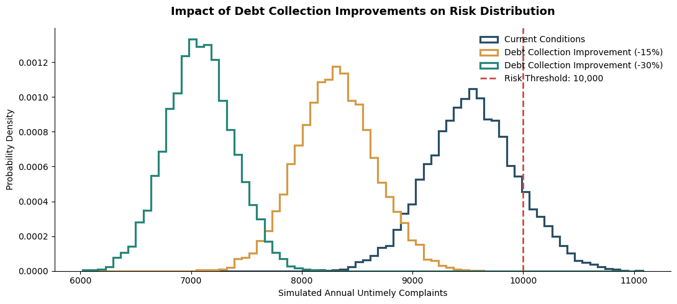
Under a covariance-based contribution calculation, debt collection contributes approximately 90.94% of total simulated variance. Checking/savings contributes 5.52%, credit cards 3.71%, and mortgages −0.17% — an offsetting covariance in these simulations, not a claim that mortgages pose no risk.
Targeted debt-collection scenarios (only debt-collection rates reduced)
| Assumption | Simulated mean | Mean avoided | P(> 10,000) |
|---|---|---|---|
| Current conditions | 9,541 | — | 13.18% |
| 15% relative reduction | 8,310 | 1,230 | 0 of 10,000 runs |
| 30% relative reduction | 7,080 | 2,461 | 0 of 10,000 runs |
10Dashboard & recommendations
Final decision dashboard and business recommendations
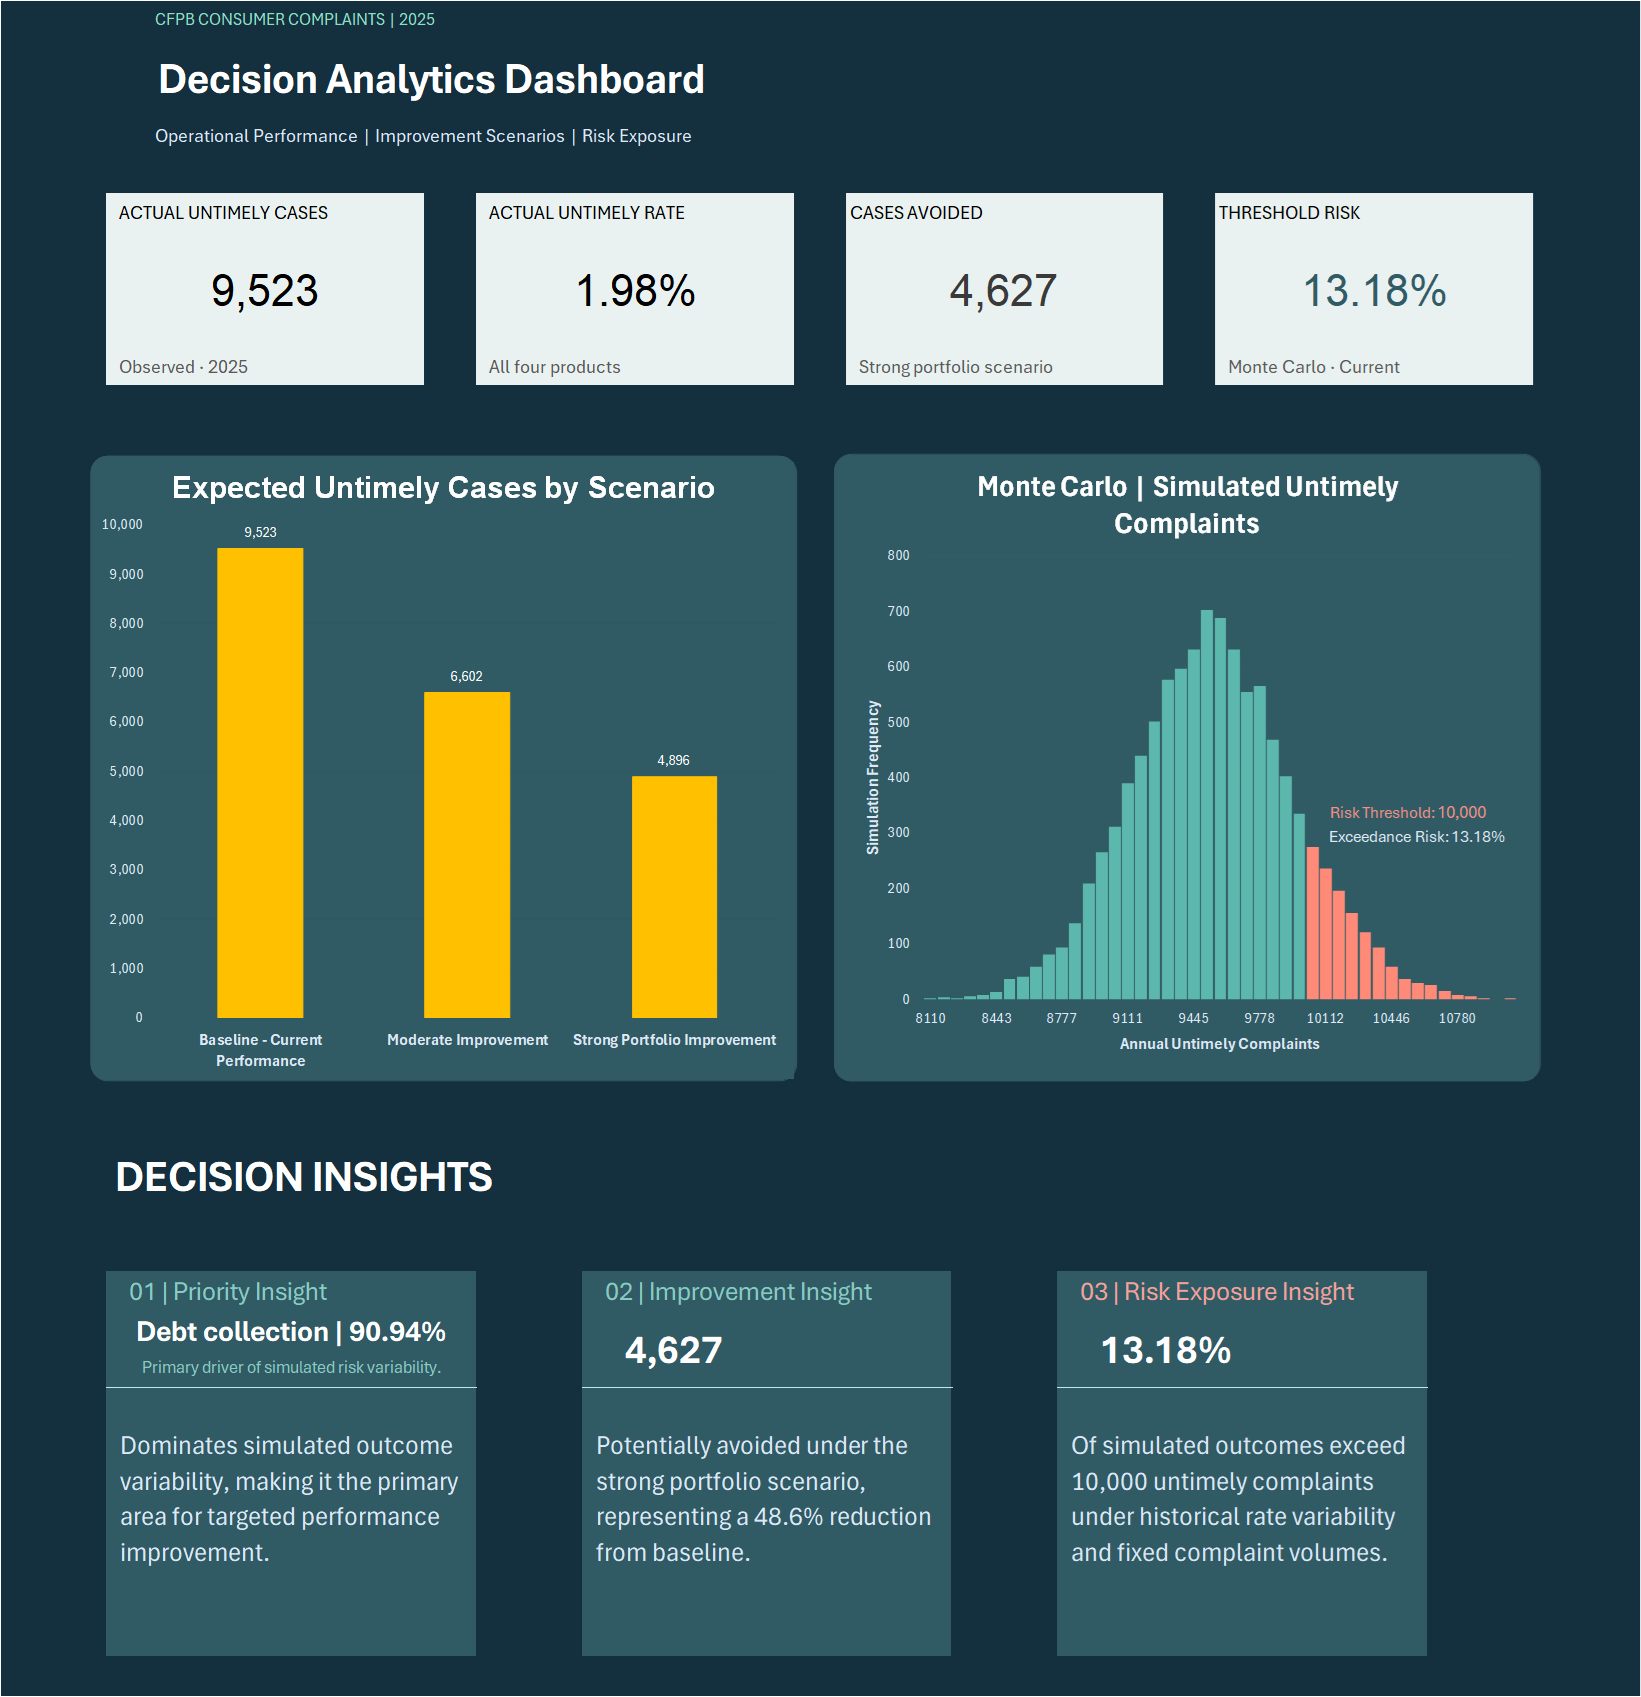
The decision dashboard combines the observed KPIs, the portfolio scenarios, and the modeled risk distribution into a single executive view.
Recommendations
- 01Prioritize a debt-collection diagnostic program, not a generic portfolio-wide intervention. Break the category down by company, issue, response classification, and month, then identify which operational hypotheses can be tested with additional internal evidence.
- 02Treat sudden performance shifts as questions before treating them as successes or failures. The CCS change is large and statistically distinguishable, but the available records do not identify the cause.
- 03Separate operational workload from response performance. Monitor complaint inflow, absolute untimely cases, and untimely rates together — January's volume concentration and April's rate peak show the danger of a single-metric dashboard.
- 04Make benchmarking conditional on composition. Geographic analysis should guide which company–product segments to review in which markets, not assign performance responsibility to states.
- 05Use scenarios to organize decisions and trade-offs. Before funding an intervention, add operational feasibility, cost, accountability, and internal validation — none of which can be inferred from this public dataset.
Data
CFPB Consumer Complaint Database
Consumer Financial Protection Bureau · Received Jan 1–Dec 31, 2025
- Checking or savings accounts, credit cards, debt collection, and mortgages
- Product, issue, company, state, and receipt date
- Company response and Timely response? status
Limitations
Limitations
- Selection and reporting: complaint submissions are not a random sample of customers or transactions; volume is not a measure of market share, prevalence, or total customer dissatisfaction.
- Recorded timeliness: the analysis uses the CFPB's public response-status field; reasons for delay and operational accountability require additional evidence.
- Confounding: differences across states, companies, issues, and months may reflect case mix, submission practices, and unobserved processes.
- Causality: the CCS investigation documents a substantial association across periods, not an intervention effect; the split was identified after observing the time series.
- Scenario limits: improvements are hypothetical, and the historical-pattern simulation cannot account for all future structural changes.
- Geographic benchmark: the 50-state comparison excludes DC, territories, and missing-state records and differs from the all-record overall rate.
Technologies
- Microsoft Excel
- PivotTables
- What-If Analysis
- Data Tables
- Goal Seek
- Monte Carlo Simulation